John Hussman is an economist who runs some mutual funds. He has been bearish and miserably wrong for a long time, but he is thoughtful and presents legitimate data. This is a decent summary of the other side of post election movement which we noted in our recent Strategy Letter.
Economic fancies and basic arithmetic
The past several weeks have brought an enormous amount of loose economic analysis encouraging investors to expect a meaningful surge in economic growth and corporate profits. Most of this hope rests on projections of higher deficit spending and increased domestic investment. It might benefit investors to consider these arguments more closely, and with greater focus on a century of economic evidence than on the verbal arguments of enthusiastic talking heads.
While there is a strong correlation between growth in gross domestic investment and growth in real GDP, the slope of that relationship is only about 0.2, meaning that even if the growth rate of real gross domestic investment was driven from the recent growth trend of zero all the way back to the previous post-war growth rate of 3.5%, the overall impact on real GDP growth would only be about 0.7% annually, placing the level of U.S. real GDP about 2.8% higher 4 years from today than it would otherwise be. That’s not an annual growth rate, but a cumulative gain.
Granted, if even a 0.7% boost to annual GDP growth was sustained, it would have a major impact on long-term living standards over a 20-30 year period. But investors have a screw loose if they believe that the overall prospects for GDP growth over the coming 4 years have changed significantly.
Let’s do some arithmetic here. The primary determinants of GDP growth over time are 1) growth in total employment plus 2) growth in real output per hours worked. There’s a little bit of cyclical variation due to changes in average hours worked, but that difference only shows up meaningfully during recessions. In practice, nearly all of the variation in GDP growth over time is explained by the sum of employment growth plus productivity growth.
Let’s look at each.
Employment growth
As of November 2016, U.S. civilian employment stood at 152.1 million jobs, with a civilian labor force of 159.5 million people, resulting in a 4.6% unemployment rate. By 2024, the Bureau of Labor Statistics projects the U.S. labor force to reach 163.8 million. Given existing U.S. demographics, even if we assume an unemployment rate in 2024 of just 4%, civilian employment would reach 157.2 million jobs in 2024, resulting in an average annual growth rate for civilian employment of just 0.4% annually over the coming 8 years. Conversely, a return to an unemployment rate of even 6% in 2024 would leave the growth rate of employment over the next 8 years at less than 0.2% annually.
While the assumptions about the future unemployment rate may be affected by policy, the fact is that slower U.S. population growth, coupled with an aging population, place substantial limits on labor force growth, which will leave U.S. GDP growth almost entirely dependent on changes in productivity. The Bureau of Labor Statistics notes that “as the population ages, more workers will enter older age cohorts, which have lower participation rates. This will cause the projected overall participation rate to decline. This slower population growth, combined with the declining participation rate, will result in slower growth in the labor force through 2024.”
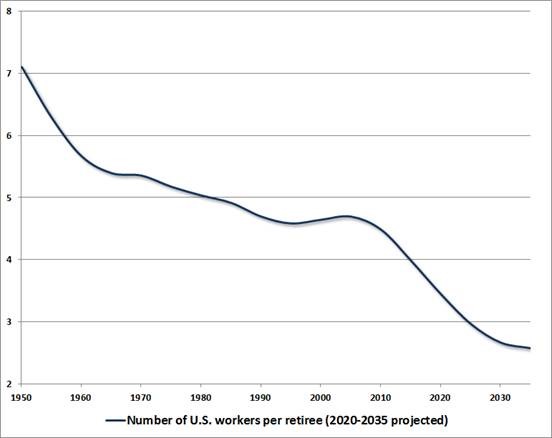
From a demographic perspective, the number of U.S. workers per retiree has been progressively declining, from more than 7 workers per retiree in the 1950’s, to 4 workers per retiree today. Over the next 20 years, that figure will decline to an estimated 2.5 U.S. workers per retiree by 2035. The BLS observes “The leading edge of the baby boomers (those born in 1946) became eligible for early Social Security benefits at age 62 in 2008 and reached full retirement age at 66 in 2012. In 2024, the baby-boom cohort will be ages 60 to 78, and a large number will already have exited the labor force. During the 2014-24 period, the growth of the labor force will be due entirely to population growth, as the overall labor force participation rate is expected to decrease even further by 2024.” That means that there will be more claims against the output of U.S. workers than ever before.
The claims being racked up against the future output of U.S. workers are of long-term concern, not only as a result of demographics, but also as the result of unproductive spending and a growing national debt. Given that every dollar of the national debt also represents an asset to someone else, my friend Robert Huebscher recently quoted an analyst who asked why we don’t call it our “national savings account.” Well, the reason is that 45% of the publicly-held debt is owned by foreigners, and the remaining debt held by the U.S. public represents future transfers of purchasing power – claims of some U.S. citizens on the future output produced by others. The original savings have already been spent, and the debt represents the claims by those who financed the spending on the future output of others.
Sure, you can devalue those claims through inflation, but only if the debt is in the form of long-maturity bonds (which is why the recent discussion of issuing 50-100 year Treasury bonds seems understandable but also a bit nefarious). At shorter maturities, inflation just raises the interest rate that the government has to pay when the shorter-term debt is rolled over. Though the weighted-average maturity of Treasury debt is currently longer than normal, the average is still only 5.8 years, and half of the debt will have to be rolled over by 2019, at whatever interest rates emerge in the interim. Ultimately, debt implies a future transfer of purchasing power, and provides only a few choices. Either you raise adequate tax revenue, or you denominate the debt in long-term bonds and devalue them through inflation, or you default, or you violate the social contract made with those who don’t hold paper claims (e.g. Social Security beneficiaries) in preference for those who do.
Had the borrowing resulted in productive investment, future output would be easily available to meet those claims. Instead, what’s going on is a quiet dilution of future living standards. That’s only going to be reversed by thoughtful policies, focused more on long-term productivity than near-term gains. Even massive debt-financed spending will not help unless the projects are intentionally designed to durably enhance the long-term productivity of the U.S. economy, to avoid duplicative capacity, and to relieve constraints that threaten to become binding in the future (personally, I remain convinced that renewable energy should be central to that list).
Productivity growth
Let’s look at that second piece of the growth puzzle, which is productivity growth. Decades of financial distortion and malinvestment have had cumulative effects that can only be reversed by decades of productive capital accumulation. It’s here where Wall Street’s exuberance is most evident. Even assuming massive and productive new spending initiatives were financed by increasing the existing $930 billion annual deficit that is now being run across federal, state and local government (the federal deficit currently accounts for about $430 billion of that annually), the impact over a small number of years would be quite limited as a percentage of GDP. The differences in growth that actually matter are those that only become significant over decades.
Since the 1940’s, the 8-year growth rate of U.S. labor force productivity has rarely exceeded 3%, and the recent trend has been progressively lower. Over the past decade, productivity growth has declined from a post-war average of 2% to a growth rate of just 1% annually, with growth of just 0.5% annually over the past 5 years. The gap between dismal productivity and the most productive economic environment in U.S. history is only about 2.5% annually.
If one studies the productivity figures, there have actually been two peaks in U.S. productivity growth during the post-war period. One was in the decade leading up to the late-1960’s, which was driven by a legitimate expansion in the productivity of U.S. workers, as measured the capacity of labor to produce output. This was something of a “golden age” for the U.S. in terms of improved living standards. There was a second, lesser peak in the decade leading up to 2003. But the reason for that surge in “productivity” was much different.
As I detailed in my November 2003 comment, titled The U.S. Productivity Miracle (Made in China), part of U.S. productivity growth actually represents the import of foreign labor by U.S. multinational companies. A significant portion of what we “import” from foreign countries actually represents intermediate goods produced by foreign affiliates of U.S. companies, which we incorporate into our final output. But we don’t count those foreign jobs when we calculate productivity (and the deduction to GDP on account of imports is generally smaller than the corresponding loss of U.S. employment), so foreign outsourcing has the effect of boosting measured productivity. As a result, I observed at the time that most of the productivity “miracle” in the decade leading up to 2003 could be explained by import growth in excess of consumption growth:
“Import growth captures both the ‘true’ part of productivity growth (since increased capital investment typically requires an expanding current account deficit) as well as the illusory part of productivity growth (resulting from the failure to account for foreign labor input in the productivity numbers). In both cases, it is misplaced optimism to expect rapid and sustained growth in U.S. productivity when the U.S. current account is already at a record deficit.”
Measured U.S. productivity, not surprisingly, has collapsed since then, and while the current account (essentially the U.S. trade balance) has narrowed as a fraction of GDP, it remains substantially negative.
The plausible range of potential GDP growth
Rapid economic growth, then, typically involves two conditions. On the employment side, it generally begins from an elevated unemployment rate, because a great deal of labor slack enables sustained growth in employment. On the productivity side, strong economic growth typically begins from points where the U.S. current account is balanced or in surplus. That’s partially because growth in real domestic investment is almost always associated with an expanding trade deficit (a regularity of the savings-investment identity – see Eating Our Seed Corn for more on this), and also because import growth drives other aspects of measured productivity growth, as explained above.
Given present conditions, the range of potential GDP growth rates over the coming 4-8 year period is much more constrained than investors may recognize.
• On the low side, but ignoring the possibility of outright recession, maintaining the current 0.5% productivity growth rate, coupled with built-in labor force demographics and a 6% unemployment rate in 2024, would result in a real GDP growth rate averaging less than 0.7% annually over the coming 8 years. Investors seem to believe that faster economic growth is a “lock,” but after a 7-year economic expansion with slow productivity growth and a 4.6% unemployment rate, there’s quite a good likelihood that growth will slow substantially even without a recession. Even including discouraged workers, the U-6 unemployment rate is now just 1.4% above its pre-crisis trough.
• On the more optimistic side, if successful policies were to produce a full normalization of productivity growth to the post-war norm of 2% annually, coupled with an unemployment rate of just 4% in 2024, real GDP growth would average 2.4% annually over the coming 8-year period.
• Finally, if we assume a sustained explosion in productivity growth to 2.8% annually, joining the highest quintile of historical U.S. productivity growth rates for any 8-year period, and assuming an unemployment rate of just 4% in 2024, the result would still be real U.S. GDP growth averaging just 3.2% annually over the next 8 years.
Combining the plausible ranges of employment and productivity growth in the coming years (but ignoring the possibility of outright recession), the bounds of average U.S. economic growth over the coming 8 years range between 0.7% annually to an extremely optimistic 3.2% annually, with a likely midpoint of less than 2% annually for real GDP. That figure aligns with the central tendency of long-run real GDP growth expectations from the Federal Reserve, which recently fell to 1.85% annually.
Look, one of my strongest economic views is that the U.S. absolutely requires a greater focus on encouraging productive investment at every level of the economy (see in particular Eating our Seed Corn and Judging Economic Policy). If our economy could grow even 1% faster over a 20-year period, the resulting 20% boost to future living standards would be an extraordinary long-term achievement. But this idea that the new administration will produce some near-term economic renaissance amounting to more than a few percent in cumulative output gains in the coming years reflects a breathtaking lack of historically-informed perspective, not to mention the inability to add two numbers together.
The problem is that even the most wildly optimistic prospects for incremental economic growth are likely to leave the level of real GDP no more than 10% higher, 4 years from now, than it otherwise would be. I strongly doubt we’ll see even that much incremental growth.
On the impact of policy
If anything, my expectation is that the policies of the incoming administration are more likely to result in constrained economic growth rather than expansion. On the labor front, there’s not a great deal that can be done about the demographics of an aging population, but with regard to incremental changes, it would appear better to ease the projected constraints through immigration, particularly favoring workers inclined to address the needs of that aging population (e.g. personal services and low-intensity health care). As for other industries, I’ve observed before that infrastructure projects on the scale of those being discussed would actually have to be implemented with foreign labor (as many of the largest U.S. construction projects have been in recent years), since heavy construction workers represent a rather small segment of the U.S. labor force. Heightened barriers to immigration will tend to tighten existing demographic constraints on the employment component of U.S. GDP growth.
Meanwhile, on the productivity front, U.S. parent companies with foreign affiliates currently employ more than one foreign worker for every two U.S. workers. The main function of those foreign workers is to expand foreign sales rather than to cut costs by replacing U.S. jobs, but some of the output produced abroad is in the form of intermediate goods that are imported into the U.S. and show up as part of our “final output.” The result is a boost to our measured productivity. Free trade has clear gains for U.S. consumers, and also benefits companies that shift jobs overseas, but there does seem to be a tendency for workers in both countries to receive an inequitable share of these gains. That said, to the extent that the incoming administration takes a punitive approach to foreign outsourcing and free trade more generally, my expectation is that it will also restrain the productivity component of U.S. GDP growth.
Let’s be clear. The economic gains and market returns that emerged during the Reagan Administration began from a starting point of 10.8% unemployment, a current account surplus, and market valuations that – on the most historically reliable measures – were less than one-quarter of present levels. However one views Reagan’s overall legacy, he also led by setting an example of personal dignity and an abiding optimism that encouraged the good in others. The present situation shares none of those features.
Instead, the arithmetic of economic expansion – employment growth plus productivity growth – is already constrained by a 4.6% unemployment rate and a deficit on current account, and seems unlikely to be helped by the current policy direction, aside from rather short-lived effects. Meanwhile, the proposed Cabinet more resembles a self-advocacy group for billionaires, corporations and war-advocates than a team of informed and civic-minded policy-makers. My increasing concern is that we won’t see much from the incoming administration that doesn’t involve intimidation, misuse of power, self-dealing, and attempts to use discretionary edict – as a substitute for equal protection and legislative process. We already observe glimpses of that, which deserve attention regardless of one’s political views.
There are certainly areas of desperation, including unemployment among minority youth and individuals with disabilities, but at the current unemployment rate of 4.6%, my impression is that the “jobs crisis” in this country is actually better described as an income crisis, because wages and salaries as a share of total income remain near record lows. An administration comprised of corporate billionaires isn’t likely to change that. Higher productivity growth, sustained over a few decades, would have a profound impact on future living standards, but to expect an economic boom of anything but the short-lived variety is to rely on arithmetic that doesn’t add up.
In any event, the problem for investors is that whatever increment we could possibly observe in GDP growth pales in comparison to the fact that the most historically reliable market valuation measures are far more than double their historical norms.
Even if investors expect economic growth and inflation to normalize, they’d better expect valuation measures to normalize as well. The tradeoff there is that extremely strong assumptions of higher growth, inflation approaching 4% annually, sustained record profit margins, and lower taxes might, at best, combine to push nominal earnings a cumulative 30% beyond their recent record highs over the next 4 years (which would be far beyond our actual expectations). But normalizing growth and inflation would also put pressure on valuation multiples to normalize, because current multiples rely almost entirely on a zero-interest rate world. Historical norms for the most reliable measures are less than half of present levels. The basic arithmetic is then: 1.3 x 0.5 = 0.65, which would still leave the S&P 500 35% lower by 2020.
Put simply, the fanciful hopes for a near-term economic renaissance are vastly overstated, and are inconsistent with the basic arithmetic of economic growth. Moreover, even the most optimistic hopes for future growth, if realized, would only boost the trajectory of real U.S. GDP by a few percent over the course of the next four years. Any significant acceleration in nominal growth would have to come from inflation. For investors, the fact remains that the most historically reliable valuation measures remain far beyond double their historical norms, and a retreat in valuations over the completion of the present market cycle is likely to overwhelm any incremental economic growth that investors might expect.