by Eugene Robin | Principal, Research Analyst
The so-called “Trump Rally” has been fascinating to watch from our vantage point. For one thing, it has made us look stupid in comparison to the benchmark we are most often compared against (Russell 2000®). But we can’t help but wonder how the facts on the ground compare to the wild animal spirits of Wall Street and the apparent unleashing of those spirits by a changeover in the administration and policy direction of the United States. We can’t possibly know if expectations are correct ex-ante but we can make general statements based on observed data points. One of those happens to be the Insider Buy/Sell ratio that tracks the tendency of company insiders to buy or sell their respective company’s stock.
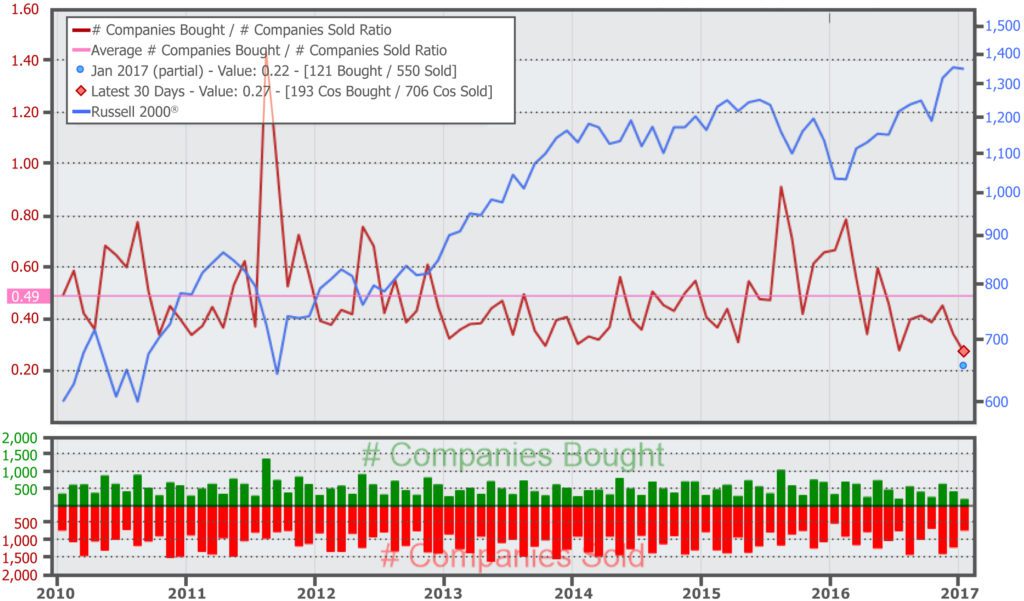
Source: ezinsider.washingtonservice.com. Data as of 01/20/17. Most recent period reflects ratio for trailing 30 days.
As shown by the above graph, the current Buy/Sell Ratio (represented by the dark red line in the chart and calculated by dividing the number of purchase transactions by the number of sale transactions by SEC identified insiders) is the lowest it has been in seven years. Additionally, if we were to go back even further in time, the current month’s reading is the lowest it’s EVER been since our data provider’s data availability begins, which would be 1988. Again, ex-ante we cannot say with certainty that this means anything but we can point to an interesting separation between the animal spirits and expectations of Wall Street against the perceived realities of individual businesses. You would expect that with a tax friendly administration coming in that stock holders should probably hold onto their shares until a new tax regime is implemented (assuming a capital gains tax of somewhere between the President’s and Congress). Yet this doesn’t appear to be the case today as insider sells have overwhelmed any buys over the past four months. We would also assume that insiders should have a better understanding of their fundamentals than outside public shareholders due to the asymmetry of information, which again creates interesting questions about perception versus reality.
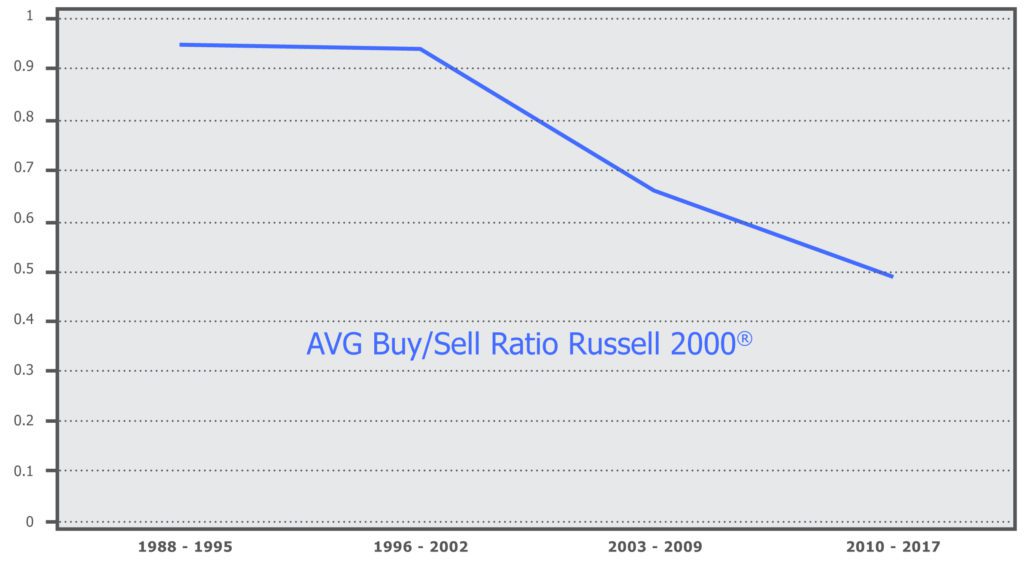
One last tidbit from this exercise is even more interesting. Dealing in 7 year chunks, we see that the average insider buy/sell ratio has declined each 7-year period examined and has created an accelerating trend toward many more insiders selling rather than buying shares. We can postulate several causes, although one logical thought would be that “equity plans, as enacted by compensation consultants and public company boards, do very little to actually incentivize executives for the long term performance of their companies with said executives instead relying more and more on equity sales as a form of immediate compensation.”
PS. For those wondering, since the average buy/sell ratio has changed over time it would be more apt to compare the current buy/sell reading against its respective trailing 7 year period’s average to get a relative measure of how low the ratio has sunk. We are happy (or petrified) to report that there has only been a single instance since 1988 when this measure has been lower than it is today: April 2007.


