
The Verdad people do interesting work. That they tend to conclude with our internal bias towards toward small and value makes them even more fascinating.
We can quibble with some of the statistical torture employed in their thought process, but what’s not to like about their conclusion?
“Our results suggest that the dispersion in private equity can be fully replicated in public markets, provided that investors focus on buying cheap, levered micro-caps and hold them in a concentrated portfolio, similar to the portfolio construction in PE.”
The Dispersion Delusion
Private equity’s return dispersion is the same as public stocks with similar characteristics.
By: Brian Chingono and Dan Rasmussen
Advocates for private equity investing often note that the dispersion of performance between top-quartile managers and bottom-quartile managers is significantly wider than the range of performance in liquid asset classes.
The implication is that private markets are less efficient, that there’s a larger role for skill, and that investors in private equity can take advantage of this dispersion through manager selection. “Manager selection is critical to strong returns, perhaps even more so in alternative investments,” J.P. Morgan argues in their Guide to Alternatives. “Dispersion in performance is pronounced in non-core real estate, private equity, venture capital, and hedge funds, underscoring the importance of choosing an effective manager to unlock the return-enhancing potential of alternatives.”
But we think this argument might be oversold. We’ve noted before that investors with large PE portfolios tend to experience a bell-curve distribution of manager performance, with less than 20% of managers falling into the top quartile. In a recent paper, researchers from the University of Chicago, Oxford, and UVA found that buyout firms who report top-quartile performance while fundraising have little to no persistence in remaining top-quartile in their subsequent fund. This means that “investors gain little by knowing the relative performance of the current fund when deciding whether to commit to the next buyout fund being raised by the same GP.” If wide dispersion in PE is attributable to high skill, then either those talents don’t persist across funds, or they cannot be recognized at the time of fundraising (although to be fair, there was one category where skill persisted among buyout mangers, and that was in the bottom quartile).
We think a more plausible hypothesis is that this dispersion reflects differences in portfolio composition between private equity and public funds. Private equity portfolios are quite different from mutual fund portfolios. First, private equity portfolios tend to have about 20 firms, whereas a typical mutual fund holds about 200. Second, private equity portfolios are overwhelmingly comprised of micro-caps, while most mutual funds focus on large- and mid-caps. Even the median small-cap mutual fund holds companies with market caps about 10x the size of a typical LBO. Third, private equity funds hold highly levered companies, with the median proportion of debt financing being 49% Net Debt/EV and the median leverage ratio being 4x Net Debt/EBITDA.
It’s also worth noting that PE funds have widely variable holding periods, with funds buying companies over a 3-5 year investment period, holding each company for 3-5 years, and then exiting.
The differences between the type of companies that private equity funds own and the type of companies that dominate public equity indices are substantial. Approximately 20% of US private equity funds are below $50M in size, and the median fund size is around $300M. Assuming PE funds have around 20 holdings on average, that would imply average equity checks of $1-3M among the smallest funds.
To create a public-market replica of the PE opportunity set, we built a levered micro-cap universe using S&P Capital IQ’s data on all US stocks from 1995 to 2022. To capture the radical size characteristics of private equity in our micro-cap universe, we set the minimum market cap at $5M and set the maximum at $2B. Minimum leverage for eligibility in the micro-cap universe is 30% Net Debt/EV. In comparison, our mutual fund universe contains both levered and unlevered companies, and the minimum market cap is $2B.
Figure 1: Median Characteristics of Micro-Cap Universe and Mutual Fund Universe (1995–2022)
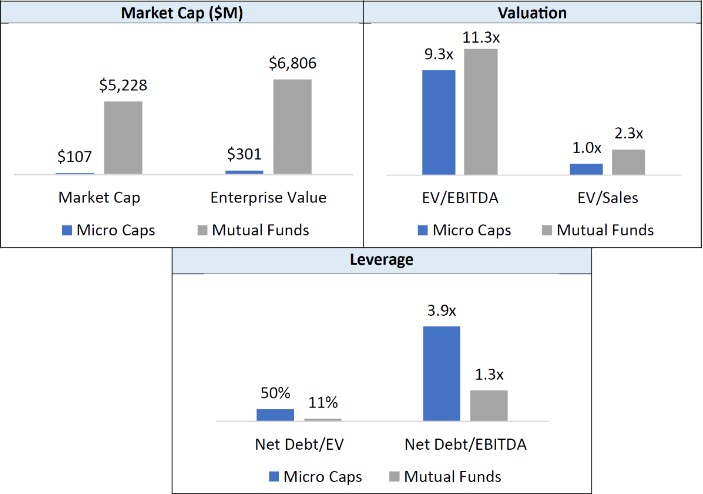
Sources: Capital IQ and Verdad analysis
We can see the impact of each of these differences by creating simulations of public equity portfolios that vary in concentration, company size, and timing of investment. The simulations start by randomly selecting a vintage year between 1995 and 2017, then including the two subsequent years to form a three-year investment period. For example, if 2000 is randomly chosen as a vintage year, the investment period will comprise 2000, 2001, and 2002. Each investment within a portfolio is sold after being held for four years. This iterative process of portfolio formation and realization is repeated 10,000 times in our simulations to create a distribution of return outcomes.
Read the full story at the Weekly Verdad.