A long, long, long time ago, I was the first client of the Applied Finance Group, which was founded by a young Rafe Resendes who spun out of the Holt Group.
What they were/are is a variant of “returns based investing” vs. the nonsense around what then was merely “PE” investing and in the adjusted “no-mans” world today, who knows what. What they also were/are is a nice piece of software that enables some interesting screening, graphics and “what if” analysis using what are still the core drivers of corporate finance and fundamental value:
-operating margins
-capital intensity and efficiency
-tax rate
-leverageThese factors then lead to a return on capital analysis, and which then begs the question – how fast should you be growing – or not – at that return measure.
It’s a cool tool that supplements our core work and is worth checking out.
Now they have gotten a little “value-added” which has pros and cons, but I think this piece is interesting – as it notes:
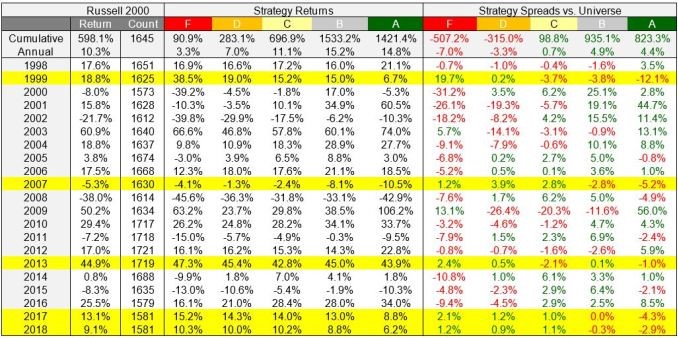
“To put the January 2017 through June 2018 period in proper perspective, it is helpful to look at how the AFG Percent to TGT-Current variable has performed over time. The following table ranks the Percent to Target-Current by sector, breaks the data into quintiles, rebalances the portfolio monthly, and then calculates each quintile’s return over time. We can see that long-term investor preference favors stocks that appear cheap (A’s) over stocks that appear expensive (F’s), with the A graded quintile outperforming the F graded quintile by nearly 11.5% annually in the Russell 2000. The relationship in quintile performance is fairly consistent across time, but there are seasons where F-graded stocks outperform their A-graded peers. This happens in 1999, 2007, 2013, and the last 18 months (i.e. 2017 and 2018 Year to Date). These periods occur near or at the end of strong Russell 2000 market performance and is typically followed by a market correction then rally where the A quintile dominates the F quintile.”
Read through to get the gist.
Investing in Small Cap Stocks: Russell 2000 Analysis
• Russell 2000 stocks currently look expensive compared to historical valuation levels
• Recent trends reflect a substantial amount of speculation on expensive, smaller stocks having negative corporate performance, low accuracy, and limited track records
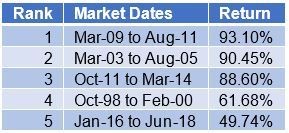
• Similar trends have typically preceded major market inflection points and is a cause for concern regarding the overall Russell 2000 and especially the expensive (F-graded Percent to Target-Current) Health Care and Information Technology companies.The Russell 2000 has performed remarkably well since the beginning of 2016. The Applied Finance Group has comprehensive point-in-time backtest history for the Russell 2000 stock universe back to 1998, and the rolling 30 month returns delivered by the Russell 2000 through the end of June 2018 is the 5th highest period of gains delivered over the last 20 years of our database.
*AFG Research, July 2018 | (Oct-98 to Feb-00 trimmed to 17 months to correspond with AFG data availability)This is especially remarkable, given that this recent run follows two additional seasons of significant appreciation in the aftermath of the financial crisis, with 93% gains between March 2009 and August 2011 immediately followed by 89% gains between October 2011 and March 2014. While seasons of significant market appreciation can be due to correcting a previous overreaction to crisis or improvements in underlying fundamentals, other times these runs may reflect irrational behavior driven by speculation.
In this article, we will first attempt to develop a healthy sense of market valuation across these different seasons where the Russell 2000 appreciated significantly. We will then further explore the performance of the Percent to Target-Current metric within each season to see if we can better understand what characteristics or themes were driving investor preference and if anything can be learned from this to better understand this recent market rally and create an actionable thesis going forward.
Russell 2000 Valuation across Time
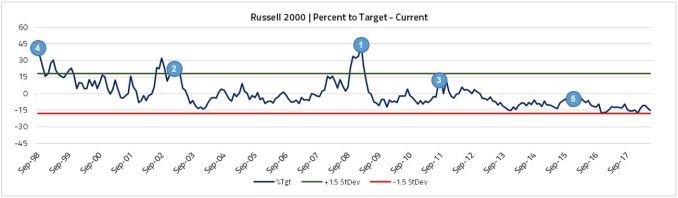
To develop an understanding of market valuation and investor behavior, AFG data can craft an objective measure that determines if a broader index is in aggregate cheap, expensive, or fairly-valued. AFG has live weekly production databases available since the end of September 1998, and we can use AFG’s intrinsic value estimates of Russell 2000 companies to monitor aggregate valuation levels of the index across time. Each weekly update includes new analyst forecasts, fundamental data, market-derived discount rates, and market prices. AFG calculates this Percent to Target-Current variable as the percentage difference between AFG’s intrinsic value and the current market price for each company at each point in time. The median Percent to Target – Current of the Russell 2000 constituents are calculated as of each month end date to develop an array of median levels over the last twenty years. The chart below displays a normalized version of this data where the relative normal crosses the X-axis at 0. This chart also displays green and red bars that identify when valuation levels exceed +/- 1.5 standard deviations from the normal valuation level.
*AFG Research, Normalized Percent to Target Trend, July 2018It is interesting to note that the two best performing 30 month seasons delivered by the Russell 2000 occurred shortly after this measure of relative valuation exceeded the 1.5 standard deviation bar reflecting intrinsic values much higher than current market prices in 2003 and 2009. (The start of each market rally in our first table is noted by a blue dot on the chart above as well as its rank) The fourth ranked season of appreciation also began while small cap stocks looked attractive, and this season corresponds with the last run of the tech bubble in the late 90s, where stocks continued to appreciate through early 2000. The third-ranked market run in 2011 immediately followed the rally in 2009, and while the market looked attractive at the beginning of this bull market, small cap stocks began to look expensive by the end of 2014 Q1. Small cap valuation recovered as markets sold off in 2015 and early 2016, but it appears that the recent rally has once again left small cap stocks appearing expensive.
Lastly, as the following table indicates, the 2009 and 2003 market rallies, which followed significant sell-offs, had most of their gains soon after the market recovery began. The 2011 and 2016 rallies, however, had the larger share of their gains in the final stages of their rallies after an initial mild appreciation in the first twelve month period.
*AFG Research, July 2018 | (Oct-98 to Feb-00 trimmed to 17 months to correspond with AFG data availability)Understanding the Current Market Environment
The recent market run is unique and interesting, as it began with a negative median Percent to Target-Current and has grown more negative through time. To better understand the current Russell 2000 market environment, we will evaluate what has occurred over the last 18 months as small cap stocks continued to appreciate due to tax breaks and perceived insulation from tariff risks. The table below shows how the sectors have performed from January 2017 through June 2018. The Health Care and Information Technology sectors (which now constitute more than 30% of the overall Russell 2000 on a market cap weighted basis) were clearly the drivers of the Russell 2000 performance for this period.
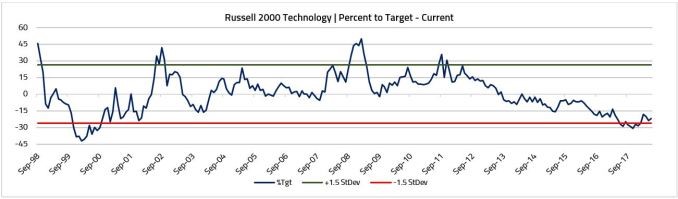
*Russell 2000 Sector Returns, Market Weight, January 2017 to June 2018, AFG ResearchThe Percent to Target-Current trend charts below for the Health Care and Information Technology sectors confirm that the sectors are expensive as each sector is either at or below the -1.5 standard deviation line from its normal valuation level.
*AFG Research, Normalized Percent to Target Trend, July 2018
*AFG Research, Normalized Percent to Target Trend, July 2018To put the January 2017 through June 2018 period in proper perspective, it is helpful to look at how the AFG Percent to TGT-Current variable has performed over time. The following table ranks the Percent to Target-Current by sector, breaks the data into quintiles, rebalances the portfolio monthly, and then calculates each quintile’s return over time. We can see that long-term investor preference favors stocks that appear cheap (A’s) over stocks that appear expensive (F’s), with the A graded quintile outperforming the F graded quintile by nearly 11.5% annually in the Russell 2000. The relationship in quintile performance is fairly consistent across time, but there are seasons where F-graded stocks outperform their A-graded peers. This happens in 1999, 2007, 2013, and the last 18 months (i.e. 2017 and 2018 Year to Date). These periods occur near or at the end of strong Russell 2000 market performance and is typically followed by a market correction then rally where the A quintile dominates the F quintile.
AFG International Backtest Database: Percent to Target – Current [Investable Universe – Sector)] from 9/30/98 to 6/30/18 (Local Return)
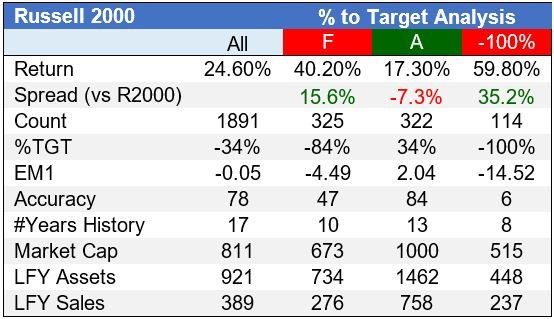
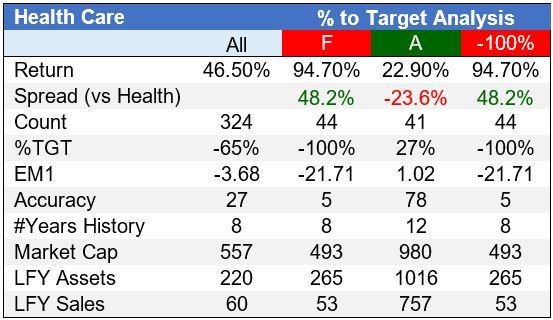
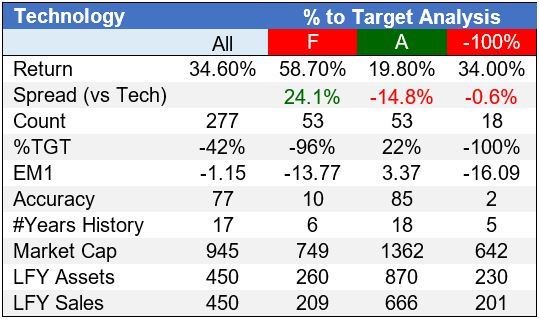
Universe Size: 1,400 to 1,800 Companies – United States (Russell 2000) | All Sectors | All Cap | ADRs IncludedThe following tables provide information on the types of companies found in the A and F quintiles for the January 2017 through June 2018 period. For simplicity we took the Russell 2000 companies at the beginning of the period, ranked their Percent to TGT-Currents by sector, divided the companies into quintiles, gathered statistics on the universe and quintiles, and calculated returns on the universe and quintiles over the next 18 months until June 2018. We have included All, F Grade, and A Grade median summary data on the entire universe (Russell 2000), as well as for the Health Care and Information Technology Sectors within the universe In addition, we provided median summary data for companies that had a -100% Percent to Target-Current, which would consist of the lowest-ranked stocks contained within the F quintile.
*AFG Research – Russell 2000 Constituent Analysis, January 2017 to June 2018Looking at the data in aggregate, the F-graded (expensive) companies clearly outperformed the A-graded (cheap) companies, especially within the Health Care and Information Technology sectors. The F-graded companies (and particularly the -100% Percent to Target-Current companies) are much poorer “quality” than their A-graded counterparts. The F-graded (and -100% Percent to Target-Current companies) have smaller Market Caps, Sales, and Total Assets than the A-graded companies. They also have less history, have negative Economic Margins (EM1=AFG’s measure of corporate performance), are more expensive, and are more difficult to value using a discounted cash flow model (lower Accuracy most likely due to insufficient operating cash flow).
Conclusion
While the Russell 2000 F-graded Percent to Target-Current stocks’ performance over the last 18 months may tempt a typical value manager to add them or a small cap Health Care or Technology ETF to a portfolio, now is not the time to chase returns. The F-graded companies are generally speculative, often start-up and/or research, companies that are not yet generating sufficient operating cash flows to cover the capital charge on their invested capital. They usually outperform A-graded companies when investors are in a speculative mood at the end of a market cycle, but later tend to underperform A-graded companies significantly during most other market environments. F-graded companies, particularly in the Health Care and Information Technology sectors, have outperformed the A-graded companies in 2017 and 2018 year to date. The Russell 2000, Health Care, and Information Technology Percent to Target-Current trend charts also appear to be historically expensive at current market prices. When the market adjusts/corrects and capital becomes tight, these F-graded companies will have a difficult time finding external financing (equity or debt) to fund their research or incremental start-up costs, which can impair their long-term growth plans and depress their market values significantly.
Contact an AFG representative if you have any questions on incorporating active management techniques into your research process. Economic Margin (EM) is a corporate performance metric owned by the Applied Finance Group, Ltd. that corrects accounting distortions to measure true economic profitability and accurately calculate intrinsic values for companies worldwide. Additional insight into Economic Margin is available on here. Additional insight into AFG’s approach to estimating intrinsic value based on forecasted Economic Margin levels is available here.
Disclaimers
The Applied Finance Group, Ltd. certifies that the views expressed in this report accurately reflect the firm’s models. The information in this report is based on material we believe to be accurate and reliable, however, the accuracy and completeness of the material and conclusions derived from said material are not guaranteed. The information is not intended to be used as the primary basis of investment decisions, and The Applied Finance Group, Ltd. makes no recommendation as to the suitability of such investments for any person. Any opinions and projections expressed herein reflect our judgment at this date and are subject to change without notice. Due to individual investor requirements, this information should not be construed as advice meant to meet the investment needs of any investor. This information is not an offer to buy or sell, or a solicitation of an offer to buy or sell any securities. Some material presented in this report was acquired from company annual reports and/or company presentations.
The Applied Finance Group, Ltd, its owners, employees and/or customers may have positions in the securities whose information is available on this report. No part of this report may be reproduced, copied, redistributed or posted without prior consent of The Applied Finance Group, Ltd.
All the information contained in this report is the property of The Applied Finance Group, Ltd. © 2018.