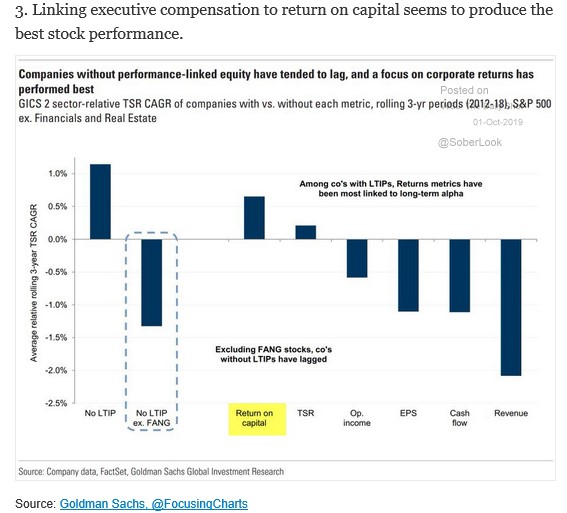
…show him or her the following chart, courtesy of Goldman Sachs (with a hat tip to the Wall Street Journal):
For those of you who don’t spend your day buried in public company proxy statements (like we do), the above chart might need a little bit of explanation. The chart measures the 2012 to 2018 return of S&P 500 companies, excluding financial and real estate companies, based on what the LTIP is tied to. What is an LTIP you ask? LTIP stands for long-term incentive plan and when it comes to public companies, the term typically refers to stock compensation plans that companies offer their employees.
Now, good companies don’t just give stock away irrespective of the financial and stock performance during the measurement period. They usually have a mix of time-based restricted stock and performance-based restricted stock. The former usually vest over a period of years and as long as the employee stays with the company, he or she is entitled to the shares that were granted. The latter are typically tied to performance metrics that the Board pre-selects; and vest only if the company hits its pre-determined targets. As a brief tangent, from Cove Street’s perspective, we much prefer that companies tie share vesting to multi-year targets. In other words, if the company is granting shares in early 2019, then it should tie the vesting to full year 2022 numbers as opposed to full year 2019 numbers. One year targets incentivize short-term thinking and could compel executives to make near-term moves that improve profitability (such as cutting R&D, marketing or capital expenditures) in the current year but will inevitably have a detrimental impact in the future. We invest with a three-to-five year outlook and prefer that companies structure their compensation to match our time horizon.
With all of that in mind, let’s revisit the chart. Your first reaction might be that it looks as though companies that don’t even have LTIPs had the best relative performance over the measured time period. And amazingly, that is true. However, according to Goldman’s analysis, if you exclude the FANG (Facebook, Amazon, Netflix and Google) stocks, the companies that did not have LTIPs actually had a negative relative TSR (total shareholder return) return over the period. I am not sure what exactly is going on with that discrepancy but that is a topic for another day. What interested me far more was the analysis of which metrics led to the highest relative returns, among the companies that do indeed utilize LTIPs. Out of the six metrics that were measured, only companies that incentivized people based on return on capital (ROC) and TSR were able to outperform—with ROC being the winner. And what about the ubiquitous EPS number that so many CEOs focus on and measure their success by? Second to worst performance, only to be outdone by revenue. The somewhat shocking thing to us, given that we are free-cash-flow-obsessed investors, is that a cash-flow-tethered LTIP also produced a negative relative return.
Like with everything we come across, there are a million questions you could ask about this data. Is the six year timeframe a relevant measurement period? What did the stock returns look like for companies that combined metrics—such as ROC AND cash flow—to determine performance vesting? We could go on and on. However, at risk of succumbing to what is known as confirmation bias, we are willing to say that we like the implications of the chart. We look to invest in companies that incentivize people based on what we care about and ROC is the metric we use the most in order to measure businesses and management teams. As such, if companies that focus on ROC also produce the best relative returns, that certainly works for us.
When we talk to CEOs and board members, we always stress the idea of alignment. So please, don’t be surprised if, as a manifestation of our “suggestivist” nature as a firm, we copy and paste the above chart to show to any portfolio company whose LTIP plan is tied to metrics such as revenue growth and EPS targets.
– Ben Claremon, Analyst
Information provided on this site is for informational and/or educational purposes only and is not, in any way, to be considered investment advice nor a recommendation of any investment product. Advice may only be provided by Cove Street Capital’s (“CSC”) advisory persons after entering into an advisory agreement and provided CSC with all requested background and account information.
From time to time on our website we may offer direct access or ‘links’ to other Internet websites. These sites contain information that has been created, published, maintained or otherwise posted by institutions or organizations independent of Cove Street Capital LLC. CSC does not endorse, approve, certify or control these websites and does not assume responsibility for the accuracy, completeness or timeliness of the information located there. Visitors to these websites should not use or rely on the information contained therein until consulting with an independent finance professional. CSC does not necessarily endorse or recommend any products or services described by these websites.
Past performance is not a guarantee or indicator of future results. The opinions expressed herein are those of Cove Street Capital and are subject to change without notice. Consider the investment objectives, risks, and expenses before investing. You should not assume that any of the securities discussed, if any, are or will be profitable, or that references we make will be profitable.
CSC is an independent investment adviser registered under the Investment Advisers Act of 1940, as amended. Registration does not imply a certain level of skill or training. Additional information about CSC can be found in our ADV Part 2A. A copy of CSC’s current written disclosure statement discussing the Company’s business operations, services, and fees is available on our website and also upon written request.