
Dan and Verdad do a great job with data annunciating what I say in 2500 non-AI words. This “relative” problem started mid-May.
“Companies with lottery-ticket, option-like payoff profiles have dominated in the last year. The profitable small-cap cohort has done quite well too, but the headline outperformance is concentrated in the story-driven loss-makers.”
And there is a lot to do with profitable companies that have been booted out of smallcap indices this summer.
Small Caps in 2026: The Lottery & the Leftovers
AI euphoria is driving a rally in US small caps
By: Daniel Rasmussen & Chris Satterthwaite
Dan appeared on the Wall Street Journal podcast Take on the Week to discuss this topic. Click here to listen.
From 1926 to 2007, small caps earned a 2% per year premium over large caps. From 2007 through 2024, small caps underperformed by roughly 3% per year. The Ken French size portfolio sorts (market-cap-weighted smallest 30% minus largest 30%) show the same trend.
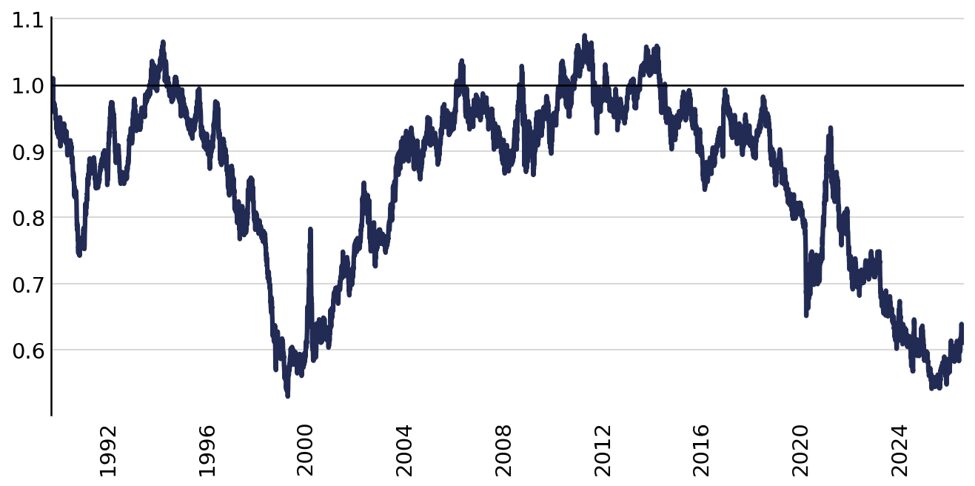
By 2023, this extended run of underperformance left small caps trading at the widest spread to large caps in 50 years. Over the last 12 months, small caps have had their day in the sun, with the Russell 2000 Total Return Index returning 37% versus the S&P 500 Total Return Index at +23%, a relative outperformance of +14%.
Figure 1: Cumulative Russell 2000 TR Index Minus S&P 500 TR Index (since 1990)
Sources: Capital IQ, Verdad analysis
New Entrants Drove Two Decades of Small-Cap Underperformance
If small caps were where the action was for 100 years, what happened? It’s impossible to ignore the explosion of private equity that coincided with the almost 20-year run of underperformance in public small caps. One appealing explanation is that private equity “hollowed out” small-cap public equities.
On the surface, however, that doesn’t appear to be true. In 1998 there were 3,200 liquid public equities (~$200K ADV); in 2026 there are 3,400. The number of available public companies has actually increased. What has changed is the composition of the small-cap cohort.
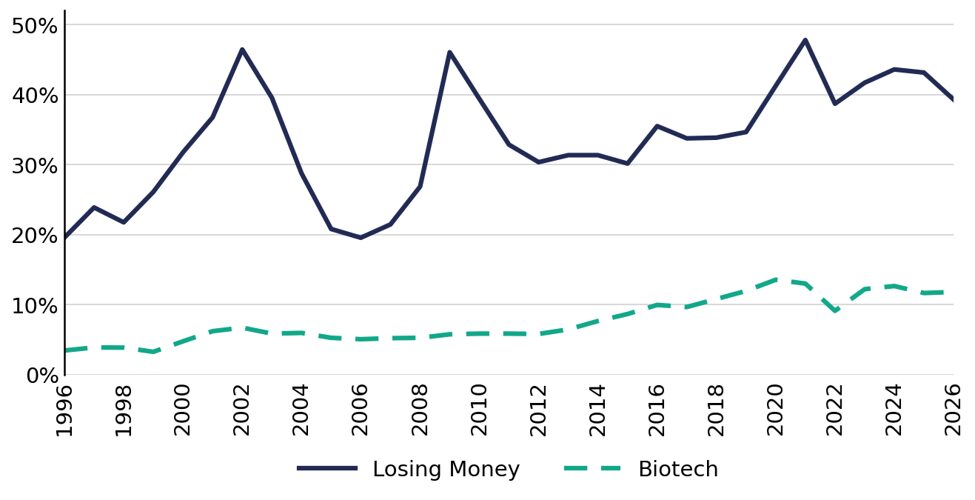
61% of the small-cap universe is “new” since 2013, and the new entrants have materially changed the characteristics of small-cap US equities in aggregate. Since the late 1990s, the loss-making share of the small-cap cohort has risen from 13% to roughly 40% today, after peaking at 48% in 2021, in large part driven by an increase in listed biotech stocks and the boom in SPACs in 2021.
Figure 2: Loss-Making Share of Small Caps and Biotech Exposure
Sources: Capital IQ, Verdad analysis
Today’s Small-Cap Loss-Makers Are Lottery Tickets
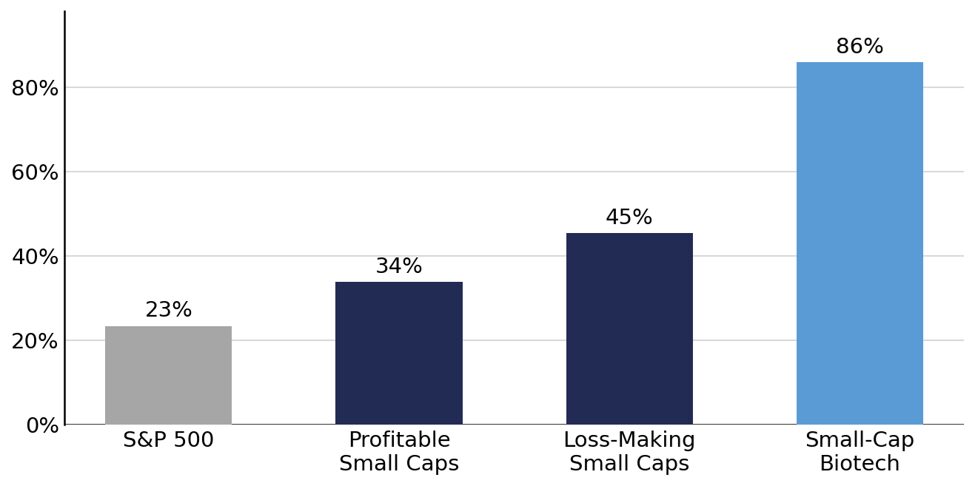
Despite the rising share of unprofitable companies, small caps have excelled in the last 12 months. And this outperformance was concentrated in the most unprofitable companies.
Figure 3: LTM Small-Cap Segmentation Performance
Sources: Capital IQ, Verdad analysis
Companies with lottery-ticket, option-like payoff profiles have dominated in the last year. The profitable small-cap cohort has done quite well too, but the headline outperformance is concentrated in the story-driven loss-makers.
This outperformance was not driven by fundamentals. Small caps tend to do better when high-yield spreads tighten, given their credit-like risk, but high-yield spreads have remained near historic lows. This was not driven by short-squeeze behavior: The highest short-interest names actually underperformed low short-interest names. It was also not driven by earnings. Multiple expansion accounted for +32% of small-cap US equity returns (+37%) while large caps actually experienced multiple contraction (−5%), earning their 23% with +28% earnings growth.
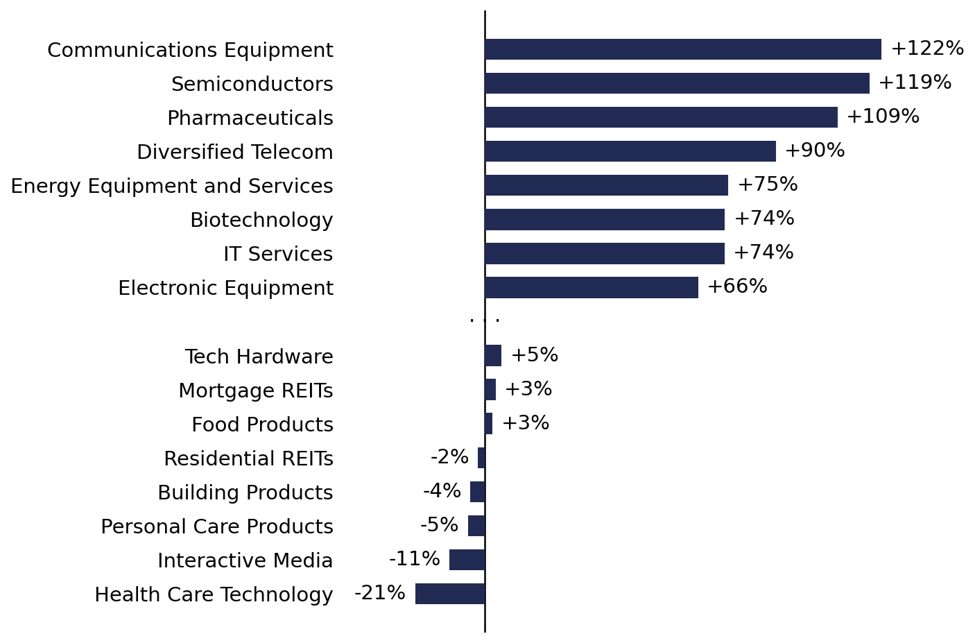
Extreme optimism surrounding potential AI beneficiaries spurred significant multiple expansion and segmented the market into thematic winners and losers.
Figure 4: LTM Small-Cap Industry Winners and Losers
Sources: Capital IQ, Verdad analysis
Small-Cap Winners Are on a Collision Course with Credit Spreads
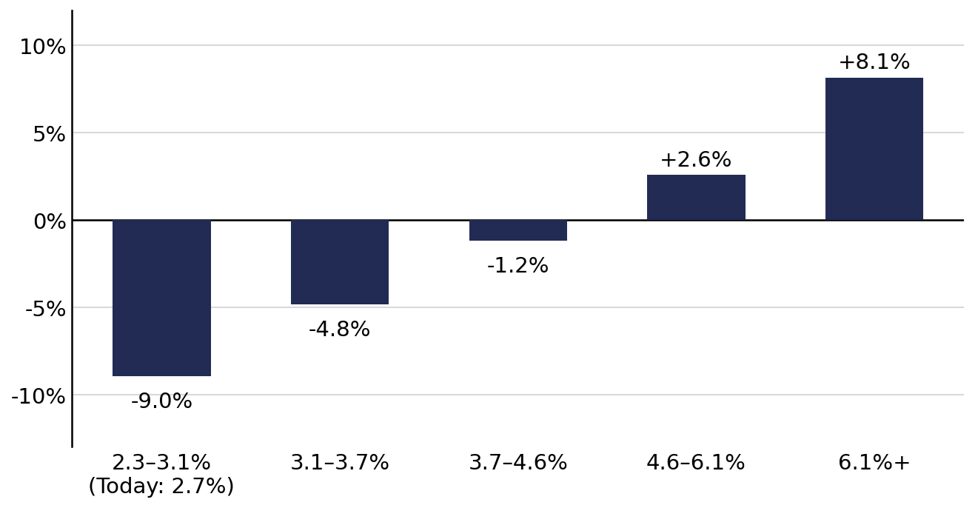
The outlook for small caps from here is mixed, especially for the biggest winners of late. With credit spreads where they are, the historical precedent is bleak. On average, the forward one-year returns for small cap minus large cap is −9% when credit spreads are this tight.
Figure 5: FWD 1Y Small-Cap Minus Large-Cap Returns vs. Credit Spreads
Sources: St. Louis FRED, Capital IQ, Verdad analysis
The macro outlook may not be ideal for small caps, especially with 44% of the index (~900 stocks) that are unprofitable. However, there may still be opportunities for picking and choosing winners within the unprofitable cohort.
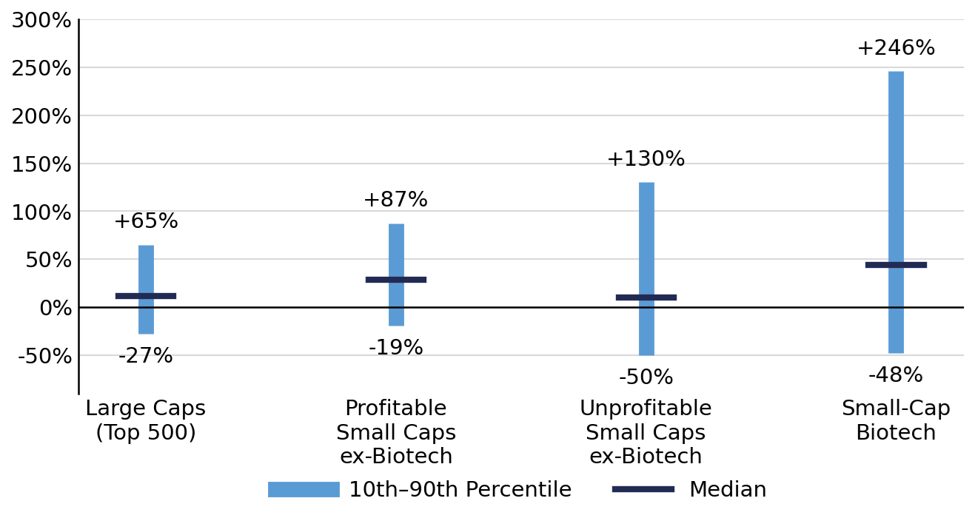
The dispersion of outcomes among these stocks is enormous, and astute stock picking within the group offers a potentially rich opportunity.
Figure 6: 90th vs. 10th Percentile LTM Return Dispersion by Cohort
Sources: Capital IQ, Verdad analysis
The changing composition of the small-cap universe, and the importance of security selection within this loss-making cohort (as well as good liquidity and short availability) led to the research we published in January and the launch of our new biotech fund.
The Discount Is Still Wide for Profitable Small Caps
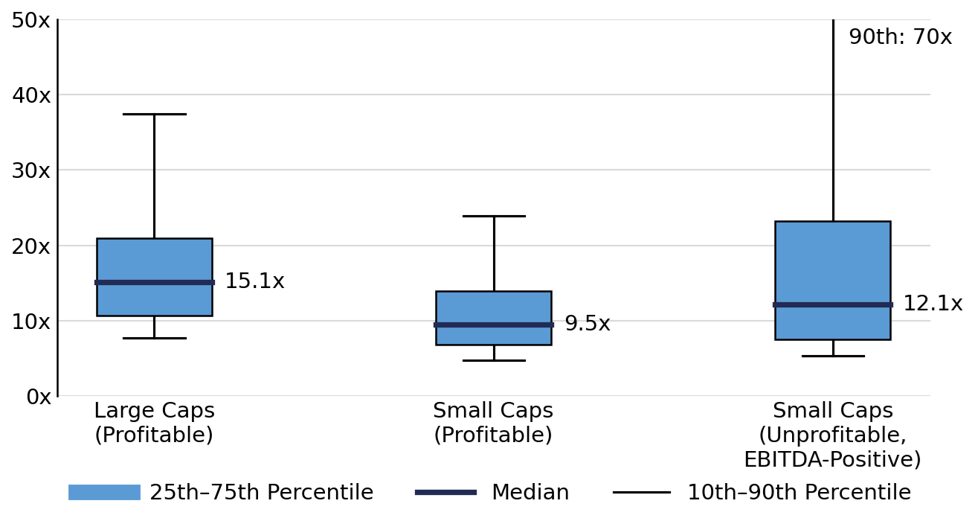
Despite the macro outlook, the value engine for the profitable cohort has worked over the last year, and the gap remains wide. Among profitable small caps, the median EV/EBITDA is 9.5x versus 15.1x for profitable large caps, a 37% discount versus the median discount of 11%. The cheapest quintile of profitable small caps returned +41% over the last year and still trades at 4.7x EBITDA.
Figure 7: EV/EBITDA of Small Caps vs. Large Caps
Sources: Capital IQ, Verdad analysis
PE vs. Small Caps: Seeing through the Froth
The rally in small-cap public equities was not a private-to-public rebalancing. That rotation is yet to come as investors realize the challenges PE face are not transitory. What we have seen is a pocket of euphoria concentrated in option-like payoffs.
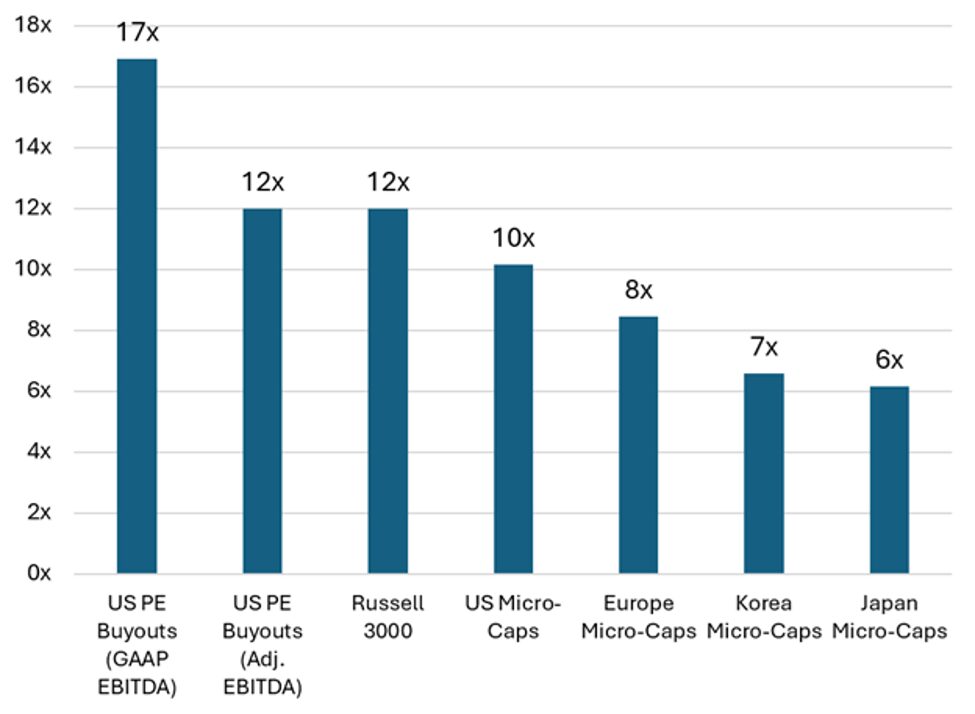
But what’s left in PE portfolios doesn’t quite look like either end of the barbell of public small caps. On one end of the barbell we have loss-making biotechs; on the other, lower-growth, very cheap, but profitable companies. PE has saturated the middle, paying up for high-growth, modestly profitable companies and closing the valuation gap versus the larger-cap cohort.
Figure 8: Median EV/EBITDA for US Private Equity vs. Microcaps by Region
Sources: S&P Capital IQ, PitchBook, Verdad analysis
The past year’s small-cap rally was real, but it was not the revaluation small-cap investors have been waiting two decades for. It was a lottery drawing. The market paid triple-digit returns to loss-making biotechs and story stocks, credit spreads barely moved, and four-fifths of the gain came from multiples rather than earnings.
History is blunt about what follows this setup. With high-yield spreads in their tightest quintile since 1989, small caps have gone on to underperform large caps by nine points over the following year, winning barely one time in seven.
But underneath the froth, an investment case for the profitable cohort is intact and has arguably improved: The profitable half of the small-cap market compounded 34% and still trades at 9.5x EBITDA against 15.1x for comparable large caps. These businesses are of the same quality as those that PE buyers pay premium multiples to own, yet they are available in liquid form at a discount.
The rally that just happened bought the part of the market that looks like venture capital. The rotation out of $13 trillion of high-priced private equity and into its cheaper, listed twin has yet to happen.
